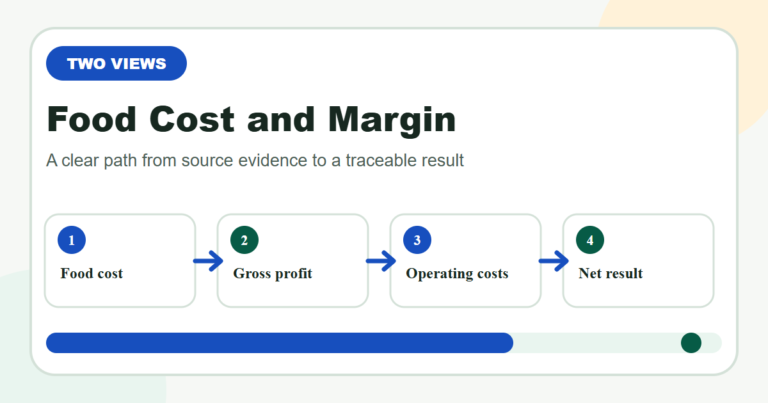
Food cost percentage and gross margin describe the same sales in opposite directions when food cost is the only cost of goods sold. They are not the same as net profit. A menu item can show an attractive gross margin and still lose money after labour, packaging, delivery, rent, and other expenses.
Define Food Cost Percentage and Gross Margin
Food cost percentage shows the share of food sales consumed by food cost. Gross margin shows the share left after cost of goods sold. Both use sales as the denominator.
Food cost percentage = food cost ÷ food sales × 100
Gross margin percentage = gross profit ÷ net sales × 100
OpenStax defines gross profit as net sales minus cost of goods sold. Food-service reports may use narrower food-cost figures, so name the cost boundary before comparing results.
See How the Two Percentages Connect
If food cost is the only cost included in cost of goods sold, food cost percentage and gross margin percentage add to 100%. A 32% food cost implies a 68% gross margin at that same boundary.
The relationship breaks when one report includes packaging, freight, beverages, transfers, or other costs and the other does not. Align the same period, sales base, and cost definition first.
The Food Cost Percentage Calculator calculates the food-cost side. This article explains how to interpret it beside margin.
Work Through a Simple Menu Example
Suppose a dish sells for PKR 1,000 and its defined food cost is PKR 320. Food cost percentage is 32%. Gross profit at this boundary is PKR 680, so gross margin is 68%.
The PKR 680 is not net profit. If labour, packaging, delivery commission, utilities, and allocated overhead total PKR 590, only PKR 90 remains before other adjustments.
Keep the currency and tax treatment consistent. Comparing a tax-inclusive selling price with a tax-exclusive food cost distorts the result.
Separate Per-Dish Cost From Period Food Cost
A recipe or plate cost uses standard ingredient quantities. A weekly or monthly food cost can use opening inventory plus purchases minus closing inventory, with approved transfers and adjustments.
These numbers answer different questions. Theoretical food cost asks what sales should have consumed at standard recipes. Actual period food cost captures purchasing, waste, portions, transfers, and inventory timing.
Compare like with like. Do not treat one dish’s recipe percentage as the whole operation’s actual percentage.
Use Contribution Margin for Menu Decisions
Contribution margin in menu engineering is selling price minus the defined item cost. It shows currency contributed by each sale, while food cost percentage shows a ratio.
A higher-priced item can have a higher food-cost percentage yet contribute more money per sale. The Basic Kitchen and Food Service Management text warns that percentage alone does not show the full menu decision.
Review both percentage and currency contribution, then consider demand and operating capacity.
Know Why Neither Number Equals Net Profit
Gross margin stops after the chosen cost of goods sold boundary. Net profit continues through labour, occupancy, utilities, marketing, depreciation, finance costs, taxes, and other expenses.
Food cost percentage is even narrower when it includes only food ingredients. It cannot by itself tell you whether a menu item or business is profitable.
Use an income statement or approved management report for the wider result. Keep recipe calculators focused on the material cost they can measure accurately.
Avoid Common Percentage and Margin Errors
- Changing the denominator: use the correct sales figure.
- Mixing cost boundaries: define what COGS contains.
- Calling gross profit net profit: subtract operating expenses later.
- Comparing different periods: align dates and inventory.
- Using percentage alone: review currency contribution.
Label every report with its cost boundary and period before sharing it.
Build a Repeatable Cost-Control Record
Use the downloadable CSV as a working record, not as a substitute for approved accounting or food-service procedures. Replace the example row with your own invoice, product specification, unit, yield, date, and approval evidence.
Keep source documents with the calculation. A second person should be able to reproduce the result without asking which pack, unit, tax treatment, or yield you meant.
Review one formula by hand and compare the result with the calculator. Investigate differences before publishing a menu price, purchase report, or production standard.
Version the record when an input definition changes. Preserve the old version so later reviews can separate a market change from a method change.
Download the Cost-Control Worksheet
Open the CSV in a spreadsheet and replace the example values with your own documented evidence.
Keep Every Number Traceable
Record the unit, source, date, boundary, calculation, and approval.
Use the Food Cost Percentage Calculator
The Food Cost Percentage Calculator performs the matching arithmetic. This article explains how to prepare and interpret the evidence placed into that calculation.
Calculate With Verified Inputs
Normalize the source information first, then run the calculation and save the result with its evidence.
فوڈ کاسٹ اور گراس مارجن کے عام سوالات
فوڈ کاسٹ فیصد کیا بتاتا ہے؟
یہ بتاتا ہے کہ فوڈ سیلز کا کتنا حصہ کھانے کی لاگت میں گیا۔
گراس مارجن کیا ہے؟
نیٹ سیلز سے کاسٹ آف گڈز سولڈ نکال کر باقی رقم کا سیلز کے ساتھ فیصد۔
کیا دونوں ہمیشہ سو فیصد بنتے ہیں؟
صرف تب جب دونوں میں ایک ہی سیلز اور ایک ہی لاگت کی حد استعمال ہو۔
کیا گراس مارجن خالص منافع ہے؟
نہیں۔ لیبر، کرایہ، بجلی اور دوسری آپریٹنگ لاگت ابھی باقی ہوتی ہے۔
کون سا نمبر بہتر ہے؟
فیصد کے ساتھ فی سیل باقی رقم اور مکمل اخراجات دونوں دیکھیں۔
Sources and Further Reading
Related Cooking Cost Tools
More Food Cost Guides

Author and Founder